Experience StrategyHealthTechPeople Leadership0 to ScaleJintronix · 7 years
Building a rehab platform patients actually finished
Most patients weren't finishing rehab at home. The tools were hard to stick with, and therapists had very little visibility into what happened between visits. I led product and experience strategy at Jintronix from the early prototype through scale.
My Role
Product Manager / UX Lead
Research · Roadmap · Team leadership · Scale
Team
1 designer · 4 Unity devs
1 portal dev · 1 QA · 1 PM (later)
Duration
7 years
Concept definition through market scale
Clinical clients at scale
500+
Hospitals, outpatient centers, and senior care facilities across US and Canada
Session time increase
15x
From 1 to 2 min up to 15 to 30 min per session at 2x per day average
Clinical outcome improvement
+25%
vs. traditional therapy methods, measured across pilot cohorts
00 · Background and Product Context
Seven years. One product. Built from a blank board into something clinics relied on.
Jintronix was the longest product build I've worked on. I joined when it was still mostly a prototype and a theory. By the time I left, it had 500+ clinical clients, published outcomes, and a reputation strong enough that therapists recommended it by name. Clinical credibility decided everything.
My scope
First and only PM for the first three years. No inherited roadmap, no existing research practice, no PM playbook. I built all of it from scratch while also doing the work.
As the company grew, I helped build the team around the work: one UX designer, four Unity developers, one portal developer, one QA, and eventually a second PM. I ran sprints, built beta clinic relationships, and kept research as a standing part of product strategy.
The goal
Get a patient to finish their prescribed program. Every product decision was evaluated against that single question.
Competitive analysis confirmed the core bet: no digital rehab platform had really solved engagement. Most of the market was some version of scheduling software plus an exercise library.
01 · Competitive Analysis and Problem Definition
Before writing a user story, I did the competitive analysis. It changed what we built.
I benchmarked every digital rehab platform I could find across engagement, clinical workflow, outcomes, and provider adoption. The pattern was consistent: scheduling tools, exercise libraries, and a few telehealth add-ons. Nobody was really solving the adherence problem.
No competitor had solved engagement
Roughly 50 to 65% of patients do not complete home exercise programs. Existing platforms treated that as normal. None had built the feedback, progress tracking, or behavioral support needed to improve it.
Therapists were making clinical decisions without adherence data
Clinicians had almost no view into what happened between appointments. They were managing recovery off self-report, and none of the competing platforms had fixed that.
There was room to build something different
No platform was competing on patient engagement in a serious way. The question was whether we could bring game mechanics into rehab without losing therapist trust. The analysis said it was worth betting on. The pilots had to prove it.
02 · Usability Research and Customer Insights
Ethnographic research inside rehab centers found things surveys would have missed
Research was a core part of this product from the start. I set up beta clinics, ran ethnographic studies in person, and kept that work going remotely during the pandemic. We sent laptops to seniors so we could keep doing usability play testing at home, including with residents at a retirement home for nuns. Seeing how people used the product in their own space changed our decisions.
Before that, I had already spent weeks inside rehab centers just watching where patients stalled, where therapists stepped in, and where paper programs quietly fell apart once someone left the clinic. Over time, product decisions were driven by, or at least checked against, real end users: seniors, therapists, and the people making purchase decisions.
I turned those observations into testable product hypotheses and tied each one to a concrete recommendation. That work also gave us three KPIs to keep coming back to: adherence, session length, and patient satisfaction.
The framework I used to turn field observations into product hypotheses we could test.
Real-time feedback changed behavior
Patients who got immediate feedback, even something as small as an audio cue for correct form, stayed engaged much longer. That made motion-sensing feedback a core MVP feature, not something to save for later.
Visible progress brought people back
Patients were more likely to return when they could see improvement over time, whether that was session count, range of motion, or simple progress against their own baseline. That became the main gamification layer.
Patients used what their therapist recommended. Full stop.
If the prescriber was not on board, the product stalled. That led directly to building the therapist dashboard alongside the patient experience, even though it was one of the most debated calls we made.
The word "gamification" made therapists uncomfortable
So we stopped using the word. The mechanics worked when they were wrapped in a clinical interface. The same ideas landed badly when they looked like games for their own sake.
"The first time my patient stood in front of Jintronix, she went for 20 minutes, wanting to win the ski activity. She changed my mind about the role of games in rehabilitation."
Dr. Aaron Bunnell, Stroke Program, UW Medicine
03 · Key Recommendations and Product Decisions
Three calls I made to leadership that I'd make the same way again
None of these calls were easy in the room. I'd still make all three.
Recommendation 1
Build the therapist dashboard as an equal MVP priority, not a phase 2 feature
The analysis
Research showed patients used what their therapist recommended. Competitive analysis showed almost nobody had invested in therapist-facing tooling. Adoption depended on the prescriber first.
My recommendation
Build both at the same time, even if it meant more scope. I framed it as a go-to-market risk, not a development cost. If therapists couldn't see patient data, they weren't going to prescribe the product.
The outcome
The therapist dashboard became one of our strongest sales tools. Once clinicians had real adherence data, they started recommending the product, and that referral network helped us reach 500+ clients without paid acquisition.
No therapist visibility, no prescription.
Recommendation 2
Cut social comparison features despite strong engagement data
The analysis
Pilot data showed leaderboards and peer benchmarking drove higher engagement. But clinical advisor review flagged that comparing recovery rates across patients with different diagnoses was clinically inappropriate and a liability in enterprise sales.
My recommendation
Cut social comparison and shift the motivation model to personal progress. Patients would compete against their own prior performance. I put the sales risk next to the engagement upside and let leadership see the tradeoff clearly.
The outcome
Engagement dipped a little at first, but the decision made hospital and senior care partnerships much easier to win.
We gave up a little short-term lift to keep the product sellable.
Recommendation 3
Scale ahead of full readiness. The market window was closing.
The analysis
After year two, the product had strong pilot data but known rough edges. The clinical team wanted more iteration. Sales had three hospital networks ready to sign. New entrants were beginning to surface in competitive analysis.
My recommendation
Scale now. I separated cosmetic issues from real functional risk and proposed expanding with existing partners while fixing the rough edges in parallel sprints.
The outcome
All three hospital networks signed that quarter. We cleaned up the cosmetic issues in two sprints and kept the lead long enough for it to matter.
We moved before the window closed.
04 · Agile Delivery and Product Evolution
From prototype to widespread clinical use seven years of the product in practice
Our sprint pattern stayed simple: make a hypothesis, build the smallest thing that could test it, measure it, and decide what to do next. I kept ceremonies lean, kept research flowing into the backlog, and tried hard not to become the bottleneck.
Early session flow wireframes. We tested timing, audio cues, and scoring as separate ideas before sending any of it into development.
Phase 2
Concept Validation
Figure out if gamification works in a real clinic, with real patients, before spending serious money on it
What happened
The pilots were where the product had to prove itself. I ran sessions at partner rehab centers, watched how therapists introduced the system, and tracked where patients dropped off. We tested mechanics one by one and cut the ones that did not move adherence.
The biggest shift in that phase came from reorganizing the activity library around the way therapists already thought about treatment planning: function and joint, not game name. Once we made that change, adoption picked up fast.
What the pilots confirmed
Gamified sessions increased average session time from 2 minutes to 18 minutes in the first pilot week
Real-time form feedback had the biggest effect on both self-correction and time spent
Progress streaks drove return behavior better than any other mechanic we tested
Therapists checked dashboards daily once patient-level session data was available
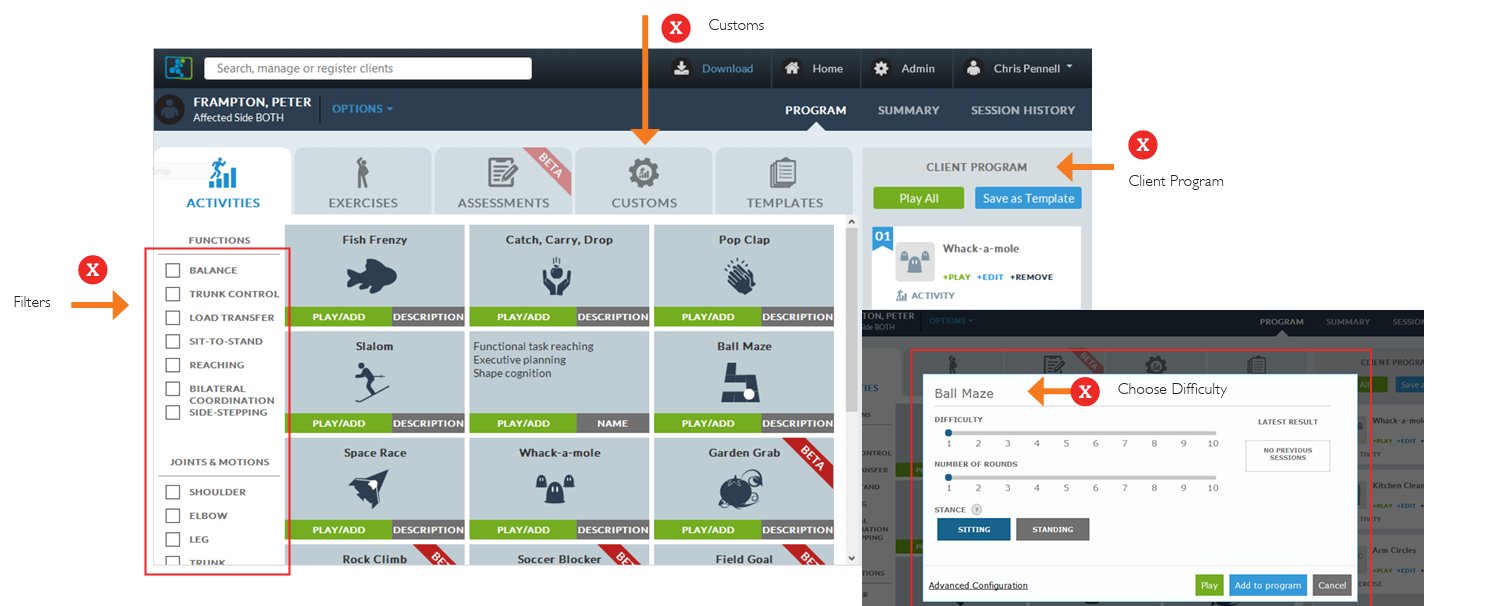
Before / After: Therapist Prescription Interface
Before
Activities were organized by game name, not clinical function. There was no filtering by therapeutic goal or body region, so therapists had to already know the system to use it well.
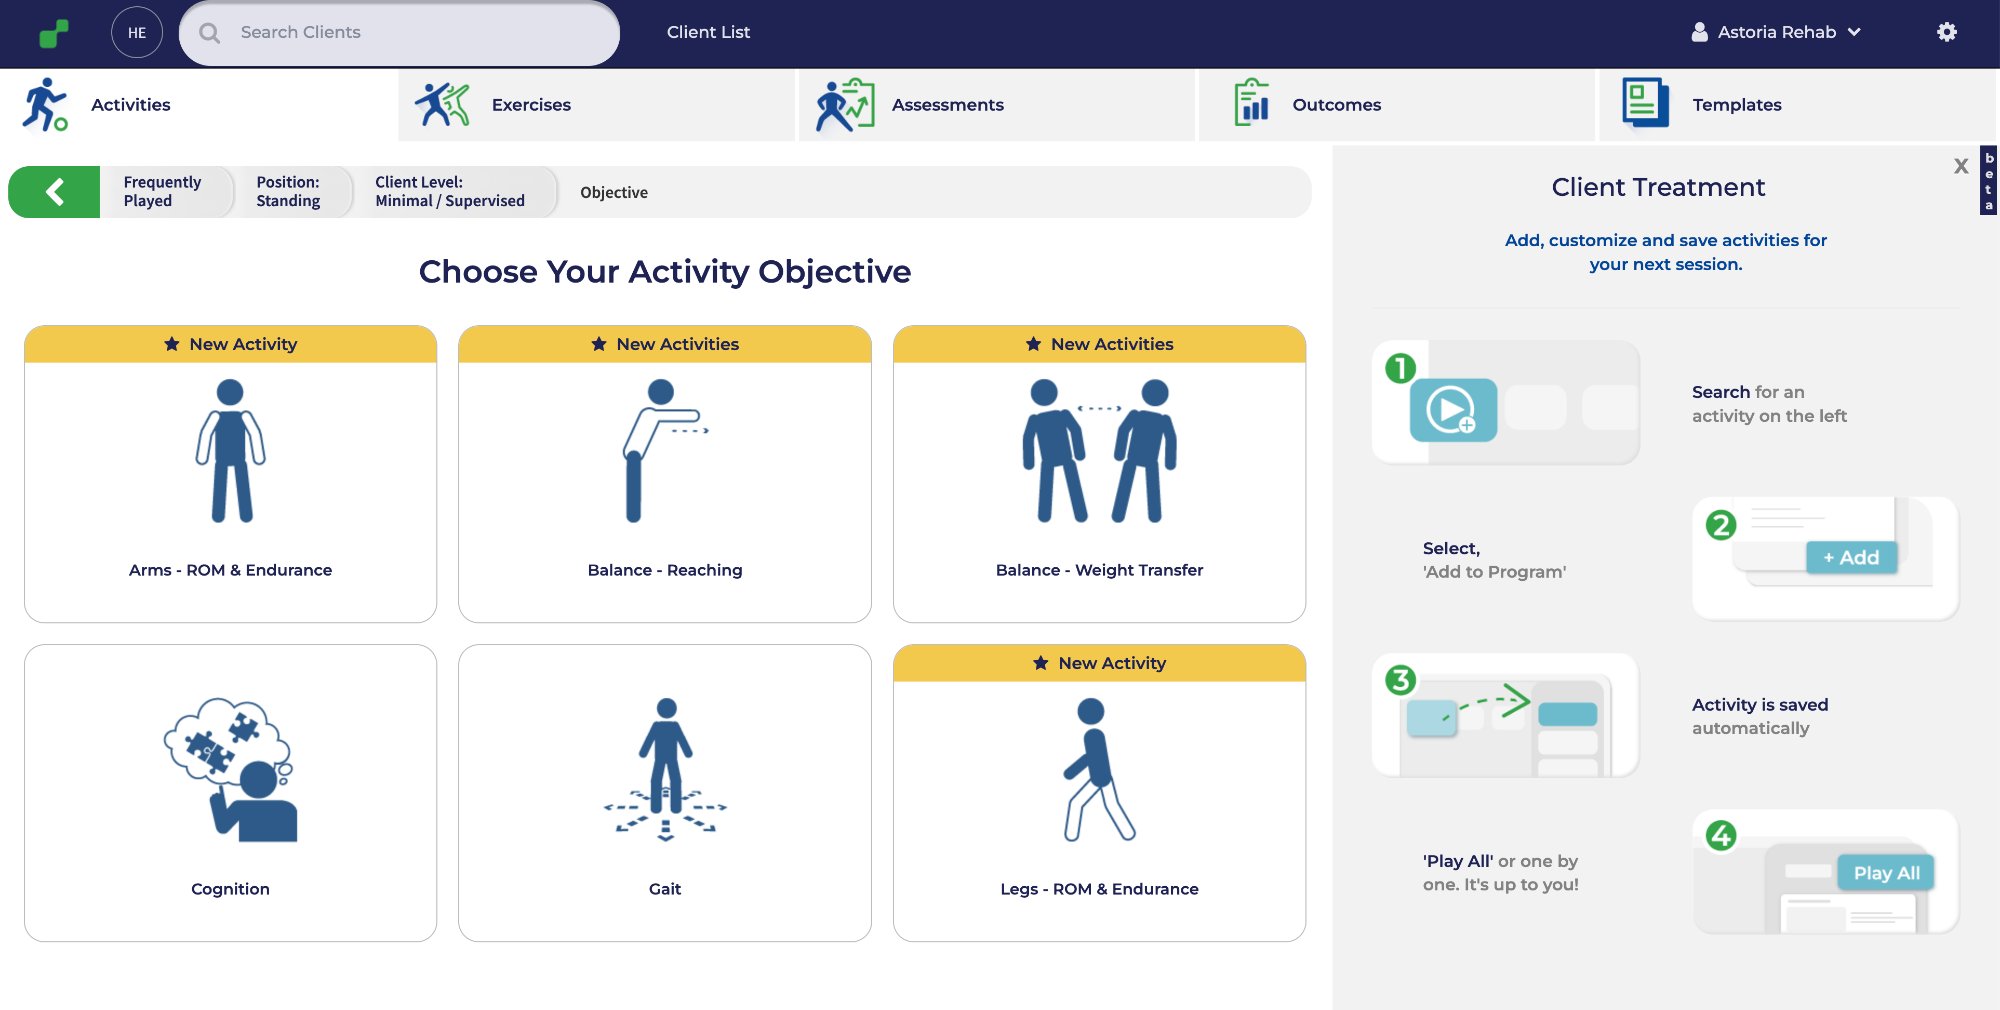
After
The redesign organized activities by clinical goal, added useful filters, and replaced a buried modal flow with a guided four-step workflow. Therapists could use it more naturally, without learning a whole new logic first.
Annotated MVP showing the therapist prescription dashboard on the left and the patient session view on the right. We built both together because the product only worked if therapists had enough visibility to trust it.
Phase 3
MVP Delivery
Ship a scalable, clinically credible platform aligned with therapist workflows and validated patient needs
What shipped
Motion-sensing exercise engine with real-time form detection and scoring
Gamified session interface: points, streaks, personal bests, progress curves
Therapist dashboard with patient adherence, session length, and range-of-motion tracking
Personalized exercise program builder organized by clinical objective
Session summary and weekly progress reports, patient-facing
Yr 1–2
Proving the hypothesis
One PM, four Unity developers, one portal developer, one QA, and one designer. No product infrastructure to inherit. The first two years were about proving that engagement mechanics could work in rehab without losing clinical trust.
Yr 3–4
Winning the therapist
The therapist dashboard became the clearest differentiator. Once clinicians could see adherence data, session length, and progress against prescription, many of them became advocates. That trust drove the first hospital network partnerships.
Yr 5–6
Scale and what it cost
Expanding across the US and Canada meant designing for clinical settings we had not originally built for, including skilled nursing, senior care, and outpatient orthopedics. The product stretched, and the team did too. As the org grew, I formalized research documentation and decision logs so hard calls did not have to be argued through again every few quarters.
Yr 7
Standard of care
By year seven we had 500+ clinical clients, published outcomes, and a place in hospital procurement. What I remember most is hearing a therapist say they could not imagine running the program without it.
05 · Business Impact and Outcomes
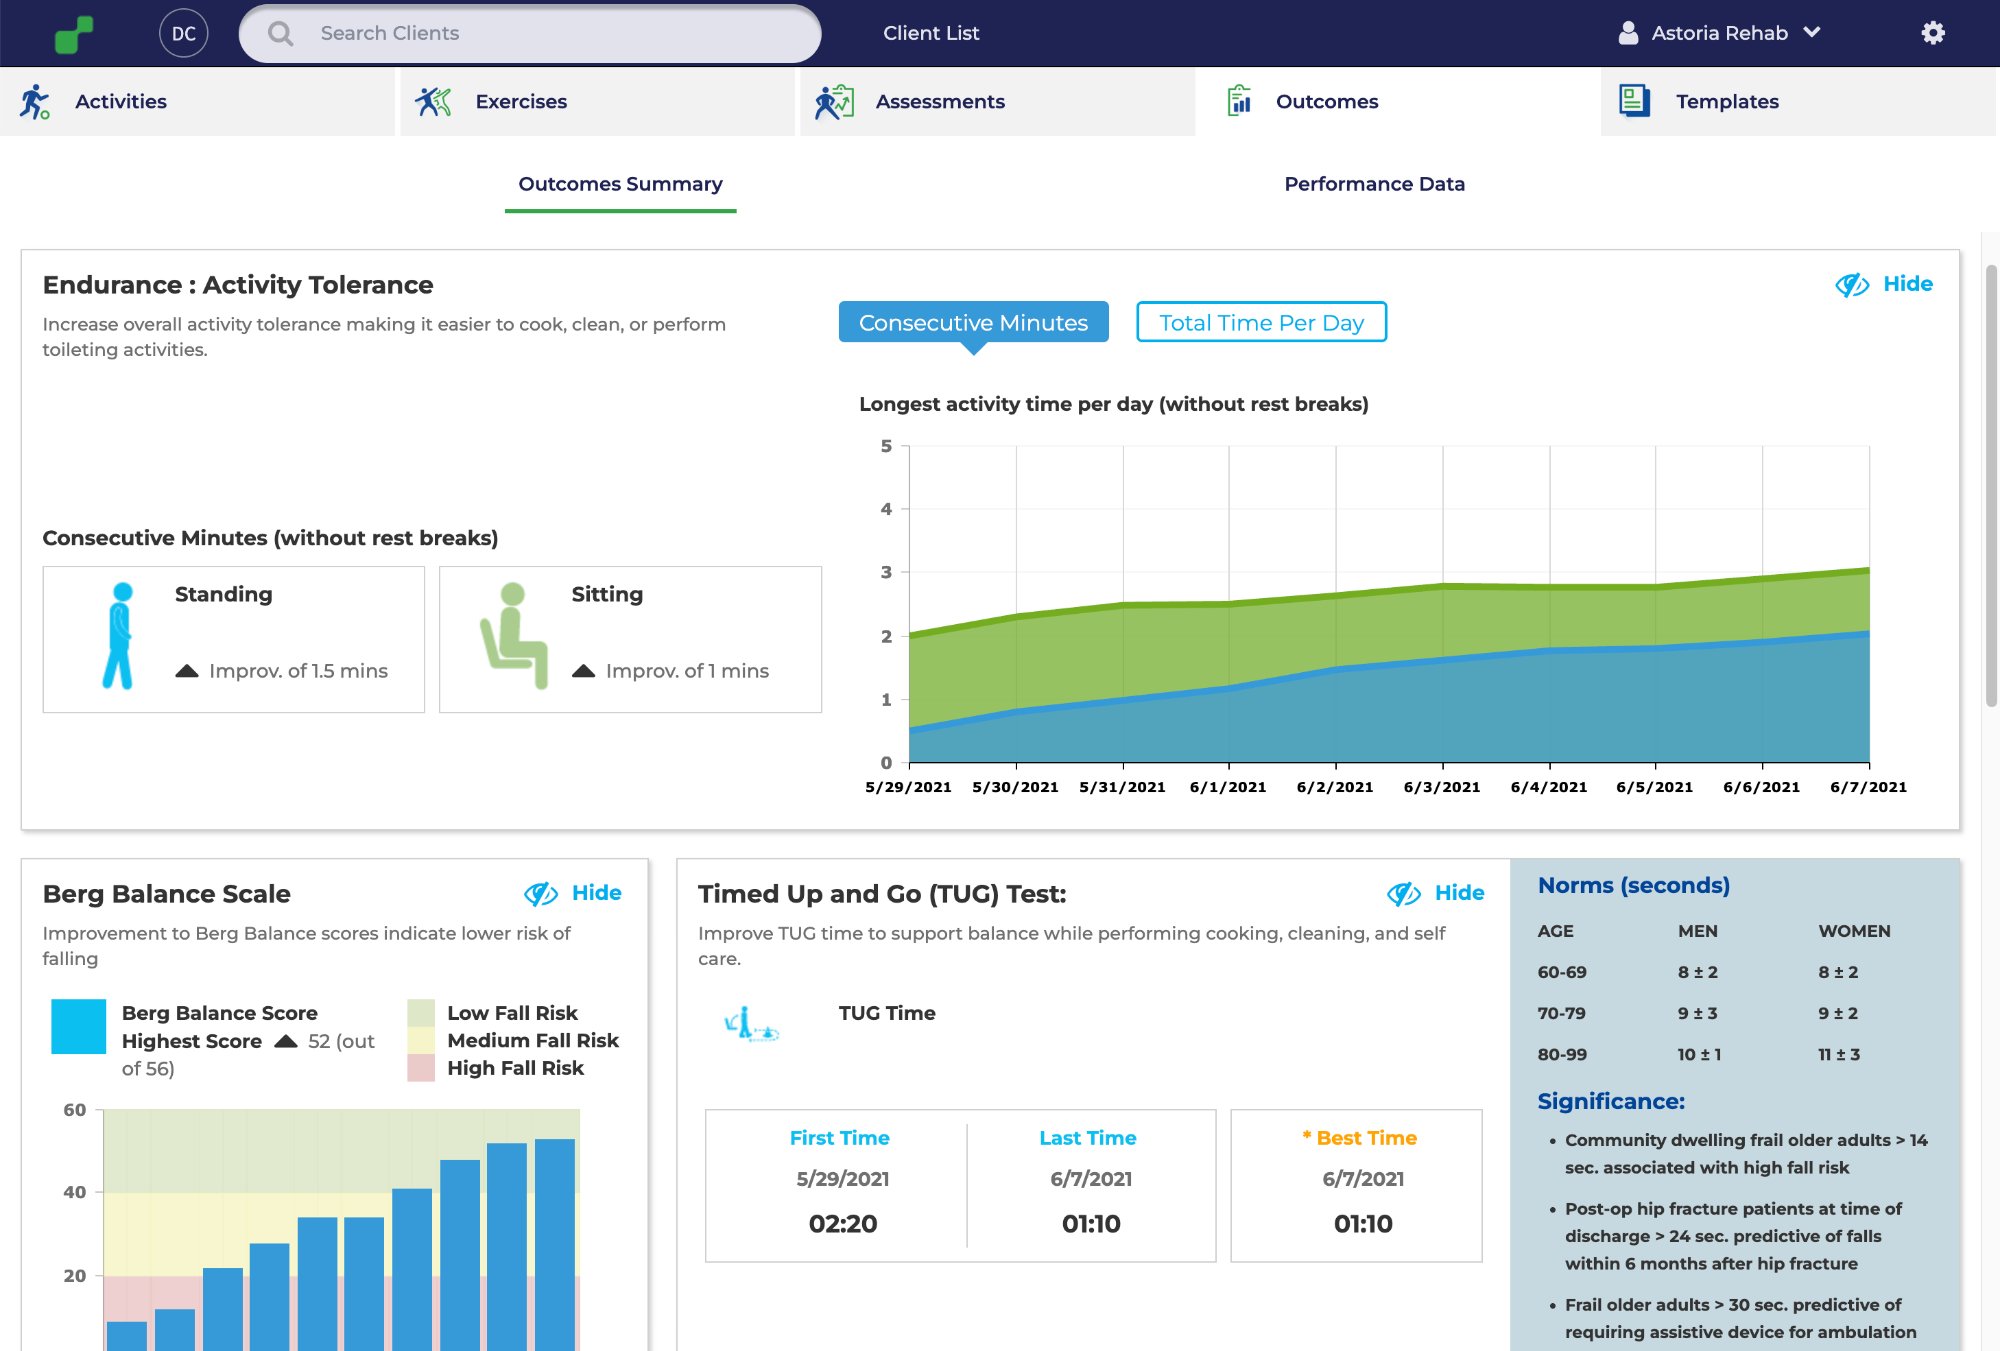
Seven years of outcomes. Here is what the data showed.
The outcomes dashboard tracked measures like Berg Balance Scale, TUG time, and activity tolerance against clinical norms. It helped with reimbursement conversations, internal buy-in, and patient motivation.
Jintronix in clinical use. The platform as therapists and patients experienced it across 500+ clinical sites.
500+
Clinical clients at scale
Hospitals, outpatient centers, and senior care facilities across the US and Canada, driven largely by therapist advocacy.
15x
Increase in patient session time
Average sessions moved from roughly 1 to 2 minutes up to 15 to 30 minutes, with about twice-daily use instead of the low follow-through common in paper programs.
+25%
Clinical outcome improvement
Patients using Jintronix showed better recovery benchmarks than traditional therapy control groups, which supported both peer-reviewed publication and contract renewal.
Up
Contract renewals
Renewal rates stayed high once a facility adopted the platform, and the outcomes dashboard came up often in renewal conversations.
06 · Retrospect
What I learned. Seven years is a long time to get things wrong and right.
What went well
Competitive analysis before any product investment
Starting with a structured benchmark gave us a defensible product thesis before we spent real money on design or engineering. It gave leadership a business case they could act on.
Ethnographic research before structured methods
Spending weeks inside real rehab centers surfaced things surveys would have missed. The core mechanics came from watching where patients actually stopped, hesitated, or gave up.
Treating the therapist as the first customer
The most important call I made on the whole project, and the least popular one in the room.
Hypothesis-driven delivery throughout
Every sprint was organized around something we could test. Cutting features people loved because they were not moving adherence took discipline, but it kept the product honest.
What I'd do differently
Build a structured clinician onboarding program earlier
Therapists were not always confident prescribing the product early on. I knew that by year two and still kept pushing onboarding down the list. That was a mistake.
Prioritize EHR integration from the start
EHR integration became an enterprise sales blocker and delayed expansion by 12 to 18 months. The competitive analysis flagged it in year one. I let "later" stand for too long.
Build a direct patient usability feedback loop earlier
For the first few years, most patient feedback came through therapists. That filtered signal made us slower to catch usability problems, and direct patient research took more time and money to set up.
Document product decisions more rigorously as the team scaled
Decisions we made in year two got reopened in year five because the rationale was not written down well enough. If you do not show your work, the team ends up re-deciding the same thing.
What energized me
The clinical pilots. Seeing a therapist realize they could finally tell what a patient was doing at home never got old. That was when the product felt real.
Building the team, too. I went from doing nearly everything myself to working with people who cared just as much about the problem and kept finding better ways to solve it.
What I'd tell myself at year one
The therapist is the customer from day one, not somewhere down the line. It took me too long to fully trust that, even though the data kept pointing back to it.
And document more than you think you need to. Not because process is beautiful, but because today's obvious decision turns into next year's argument surprisingly fast.